Context
Purpose
The goal is to experiment with how to read NorESM data for FAIR2Adapt Case Study 1.
Description
In this notebook, we will:
- Open online NorESM data
- Visualize one field
Contributions
Notebook
- Anne Fouilloux, Simula Research Laboratory (Norway) (reviewer), annefou
Bibliography and other interesting resources
Import Libraries
# Install xarray-healpy and dggs libraries for regridding
#!pip install git+https://github.com/IAOCEA/xarray-healpy.git git+https://github.com/xarray-contrib/xdggs.git cmcrameri s3fs shapely
import cartopy.crs as ccrs
import matplotlib as mpl
import matplotlib.pyplot as plt
import numpy as np
import s3fs # For accessing file storage at Amazon S3
import xarray as xr # N-dimensional arrays with dimension, coordinate and attribute labels
xr.set_options(display_expand_data=False, display_expand_attrs=False, keep_attrs=True)<xarray.core.options.set_options at 0x109e75c10>Open file with Xarray
- The file is on the cloud (accessible to everyone)
- The first time, opening the atmosphere ds typically takes a few minutes
- Therefore, we save a local version with selected subset of variables for faster loading the nezxt times
# Define file paths
endpoint_url = "https://server-data.fair2adapt.sigma2.no"
filename_atmosphere = "s3://CS1/data/model/JRAOC20TRNRPv2_hm_sst_2010-01.nc"

# Extract file from S3
client_kwargs = {"endpoint_url": endpoint_url}
s3 = s3fs.S3FileSystem(anon=True, client_kwargs=client_kwargs)

# Opening the atmosphere ds typically takes a few minutes
ds = xr.open_dataset(s3.open(filename_atmosphere))

# Display the subset dataset
ds
Loading...
Load grid
grid_type = "p"
grid_file = "s3://CS1/data/grid/grid.nc"
grid = xr.open_dataset(s3.open(grid_file))
grid
Loading...
Assign coordinates to Xarray Dataset
ds = ds.assign_coords({"lon": grid[grid_type + "lon"]})
ds = ds.assign_coords({"lat": grid[grid_type + "lat"]})
ds
Loading...
Quick visualization
var = "sst"
vmin = -3
vmax = 20
proj = ccrs.NearsidePerspective(
    central_longitude=0.0, central_latitude=80.0, satellite_height=3e6
)
fig, ax = plt.subplots(1, figsize=(8, 4.5), dpi=96, subplot_kw={"projection": proj})

p = (
    ds[var]
    .isel(time=0)
    .plot(
        ax=ax,
        transform=ccrs.PlateCarree(),
        x="lon",
        y="lat",
        add_colorbar=False,
        vmin=vmin,
        vmax=vmax,
        cmap="viridis",
        shading="auto",
        rasterized=True,
    )
)
# Add coastlines and the lat-lon grid
ax.coastlines(resolution="50m", color="black", linewidth=0.5)
ax.stock_img()
gl = ax.gridlines(ylocs=range(15, 76, 15), draw_labels=True)
gl.ylocator = mpl.ticker.FixedLocator([40, 50, 60, 70, 80])

plt.colorbar(p, fraction=0.2, shrink=0.4, label="degC")

ax.set_title("Sea Surface Temperature")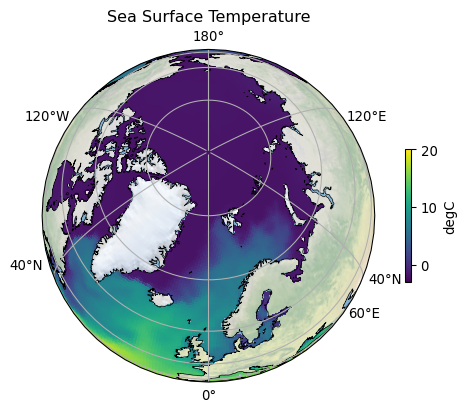
# Define file paths
endpoint_url = "https://server-data.fair2adapt.sigma2.no"
filename_atmosphere = "s3://CS1/data/model/JRAOC20TRNRPv2_hm_U236GF_2010-2018.nc"

# Extract file from S3
client_kwargs = {"endpoint_url": endpoint_url}
s3 = s3fs.S3FileSystem(anon=True, client_kwargs=client_kwargs)

# Opening the atmosphere ds typically takes a few minutes
ds = xr.open_dataset(s3.open(filename_atmosphere))

# Display the subset dataset
ds
Loading...
ds.U236GFLoading...
def create_plot(ds, var, vmin, vmax, time=np.nan, sigma=True):
    proj = ccrs.NearsidePerspective(
        central_longitude=0.0, central_latitude=80.0, satellite_height=3e6
    )
    fig, ax = plt.subplots(1, figsize=(8, 4.5), dpi=96, subplot_kw={"projection": proj})
    if time is not np.nan:
        p = (
            ds[var]
            .isel(time=0)
            .plot(
                ax=ax,
                transform=ccrs.PlateCarree(),
                x="lon",
                y="lat",
                add_colorbar=False,
                vmin=vmin,
                vmax=vmax,
                cmap="viridis",
                shading="auto",
                rasterized=True,
            )
        )
    elif sigma:
        p = ds[var].plot(ax=ax, add_colorbar=False, vmin=vmin, vmax=vmax)
    else:
        p = ds[var].plot(
            ax=ax,
            transform=ccrs.PlateCarree(),
            x="lon",
            y="lat",
            add_colorbar=False,
            vmin=vmin,
            vmax=vmax,
            cmap="viridis",
            shading="auto",
            rasterized=True,
        )
    # Add coastlines and the lat-lon grid
    ax.coastlines(resolution="50m", color="black", linewidth=0.5)
    ax.stock_img()
    gl = ax.gridlines(ylocs=range(15, 76, 15), draw_labels=True)
    gl.ylocator = mpl.ticker.FixedLocator([40, 50, 60, 70, 80])
    plt.colorbar(p, fraction=0.2, shrink=0.4, label="degC")
    ax.set_title(ds[var].attrs["long_name"])
var = "U236GF"
vmin = ds[var].min().values
vmax = ds[var].max().values
print(vmin, vmax)
# create_plot(ds, var, vmin, vmax, sigma=True)# Define file paths
endpoint_url = "https://server-data.fair2adapt.sigma2.no"
filename_atmosphere = "s3://CS1/data/model/JRAOC20TRNRPv2_hm_U236LH_2010-2018.nc"
# Extract file from S3
client_kwargs = {"endpoint_url": endpoint_url}
s3 = s3fs.S3FileSystem(anon=True, client_kwargs=client_kwargs)
# Opening the atmosphere ds typically takes a few minutes
ds = xr.open_dataset(s3.open(filename_atmosphere))
# Display the subset dataset
dsds.U236LH# Define file paths
endpoint_url = "https://server-data.fair2adapt.sigma2.no"
filename_atmosphere = "s3://CS1/data/model/JRAOC20TRNRPv2_hm_U236PPG_2010-2018.nc"
# Extract file from S3
client_kwargs = {"endpoint_url": endpoint_url}
s3 = s3fs.S3FileSystem(anon=True, client_kwargs=client_kwargs)
# Opening the atmosphere ds typically takes a few minutes
ds = xr.open_dataset(s3.open(filename_atmosphere))
# Display the subset dataset
dsds.U236PPG# Define file paths
endpoint_url = "https://server-data.fair2adapt.sigma2.no"
filename_atmosphere = "s3://CS1/data/model/JRAOC20TRNRPv2_hm_U236SF_2010-2018.nc"
# Extract file from S3
client_kwargs = {"endpoint_url": endpoint_url}
s3 = s3fs.S3FileSystem(anon=True, client_kwargs=client_kwargs)
# Opening the atmosphere ds typically takes a few minutes
ds = xr.open_dataset(s3.open(filename_atmosphere))
# Display the subset dataset
dsds.U236SF# Define file paths
endpoint_url = "https://server-data.fair2adapt.sigma2.no"
filename_atmosphere = (
"s3://CS1/data/model/NSSP245frc2NRP205p2v2_hm_I129se40_205001-205912.nc"
)
# Extract file from S3
client_kwargs = {"endpoint_url": endpoint_url}
s3 = s3fs.S3FileSystem(anon=True, client_kwargs=client_kwargs)
# Opening the atmosphere ds typically takes a few minutes
ds = xr.open_dataset(s3.open(filename_atmosphere))
# Display the subset dataset
dsds.I129se40# Define file paths
endpoint_url = "https://server-data.fair2adapt.sigma2.no"
filename_atmosphere = (
"s3://CS1/data/model/NSSP585frc2NRP205p2v2_hm_I129se40_205001-205912.nc"
)
# Extract file from S3
client_kwargs = {"endpoint_url": endpoint_url}
s3 = s3fs.S3FileSystem(anon=True, client_kwargs=client_kwargs)
# Opening the atmosphere ds typically takes a few minutes
ds = xr.open_dataset(s3.open(filename_atmosphere))
# Display the subset dataset
dsds.I129se40