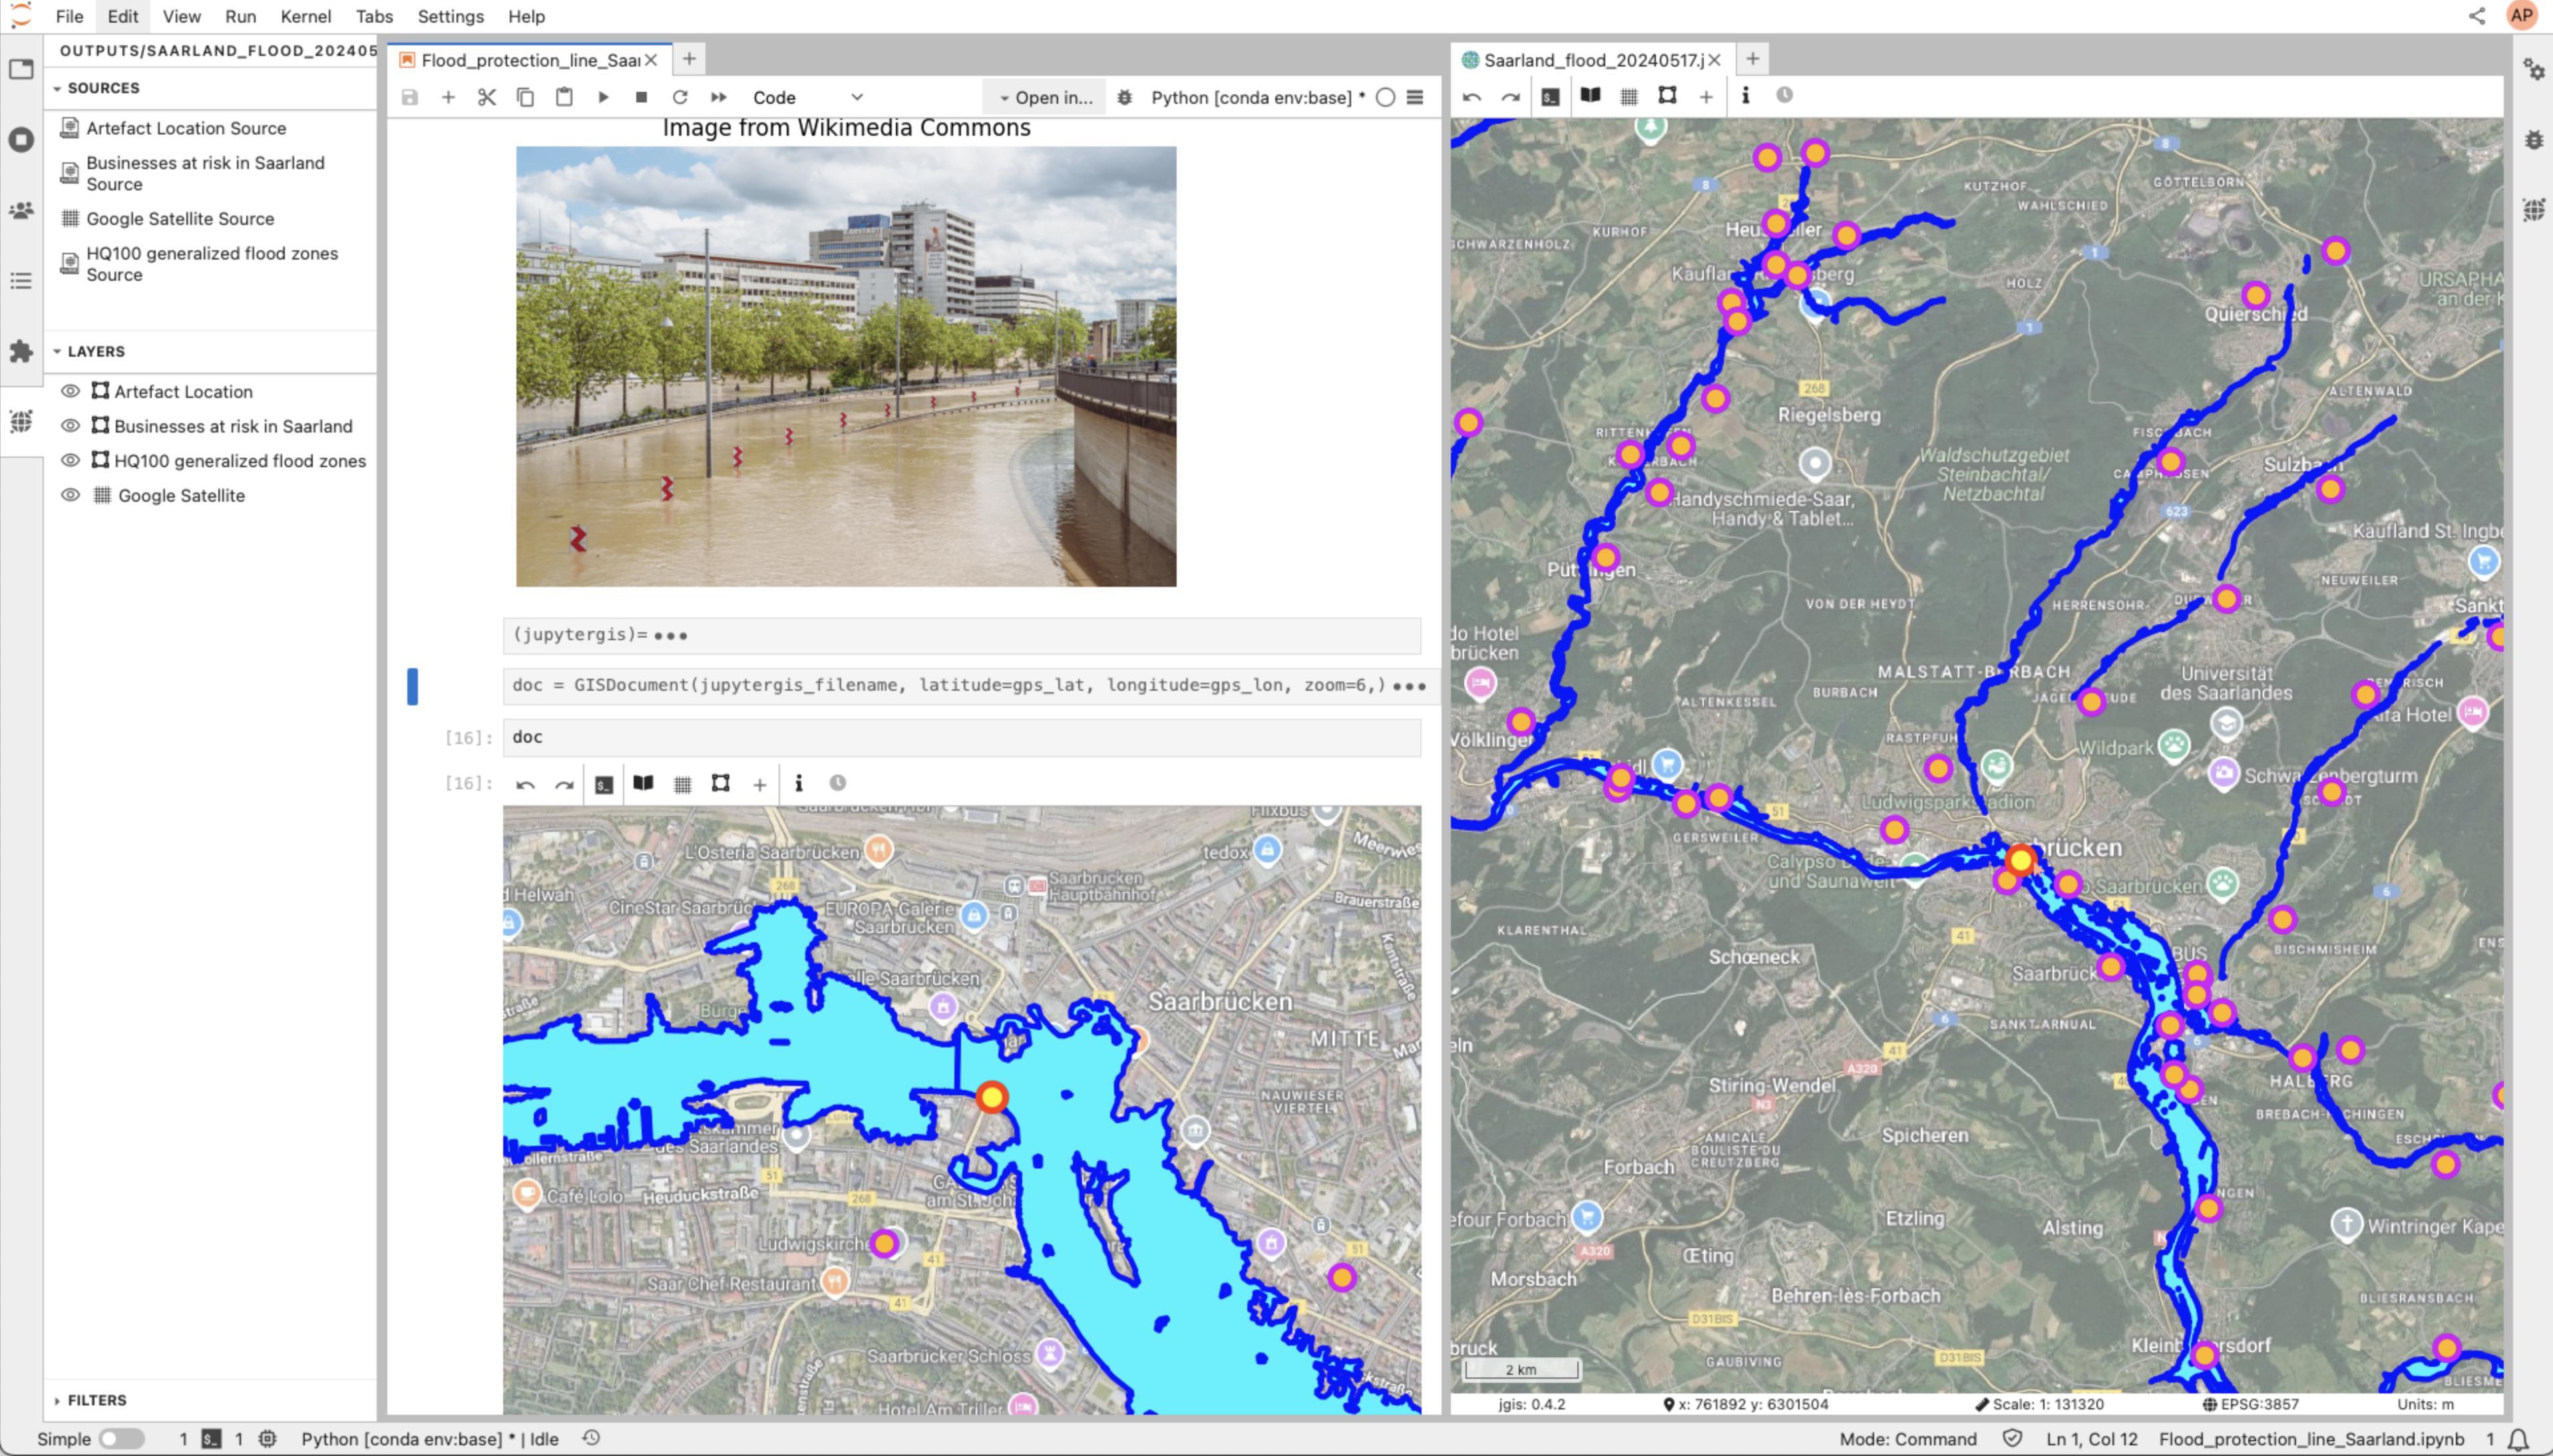
We showcase the usage of JupyterGIS for creating geographical maps showing the HQ 100 flooding zones in Saarland along with images from Wikimedia Commons.
These notebooks showcase how to use JupyterGIS.
We use JupyterGIS on the UseGalaxy.eu. The tool can be launched from JupyterGIS in Galaxy Europe. Please prior to use it, register to usegalaxy.eu and authenticate yourself before starting it.
To help new users get started, there are two tutorials available:
- Intro to JupyterGIS a step-by-step guide for new users.
- Collaborative Features Tutorial — a guide for exploring real-time editing and shared annotations.