This notebook derives a coarser HEALPix “parent chunk” footprint from a Region Of Interest (ROI) that is already represented on a HEALPix nested grid.
The resulting footprint can be used to summarize / tile the ROI at a chosen parent depth and to overlay that footprint on the original ROMS field in lon/lat for validation.
Workflow
Load ROI already expressed in HEALPix cell IDs (nested indexing).
Select a parent depth and compute parent IDs with
healpix_geo.nested.zoom_to(...).In this notebook I tested parent depths 9 and 10, and finally chose 10 as a good compromise.
Build polygon geometries for the parent cells using
healpix_geo.nested.vertices(..., ellipsoid="WGS84"), then union them into a single footprint polygon.Plot and validate: overlay the footprint boundary on a ROMS variable (e.g., salinity) on its curvilinear lon/lat grid (
nav_lon_rho,nav_lat_rho).
Notes
Geometry is handled in geographic lon/lat;
healpix_geocalls use the WGS84 ellipsoid.If longitudes appear in a 0–360 convention, we wrap to [-180, 180] for plotting.
Next step
Next step is to go back to prep_regrid.ipynb, chose this parent cell id’s area (and may be one level 13 healpix neighbour area ?? as regridding mapping
import healpix_geo
import numpy as np
import xarray as xr
Step 1 — Load the HEALPix ROI
Load the dataset containing the ROI already expressed as HEALPix cell IDs (nested).
xr.open_zarr("hp.zarr")ds_hp = xr.open_zarr("hp.zarr")experiment the parent cell size
First it load region of interest already in healpix grid. Then select parent cell id (here I experimented cell id 9 and 10 , and in the end I chose 10. The model will have 20 years of time series (data store in hourly) having small enough chunk size on cell_id is requried to make analysis
Step 2 — Compute parent cell IDs
Convert ROI cell IDs at depth D into parent IDs at a coarser depth parent_depth using healpix_geo.nested.zoom_to(...).
In this notebook, I compared parent_depth = 9 vs 10 and selected 10.
ipix = ds_hp["cell_ids"].values.astype(np.uint64)

depth = 13
parent_depth = 10
parents = healpix_geo.nested.zoom_to(ipix, depth=depth, new_depth=parent_depth)

uniq_parents, counts = np.unique(parents, return_counts=True)
counts, counts.size
(array([36, 36, 64, 36, 34, 33, 13, 61, 64, 15, 46, 13, 63, 58, 64, 28, 18,
21, 13, 22, 36, 21, 64, 36, 36, 64, 64, 64, 64, 64, 64, 64, 64, 64,
64, 64, 64, 61, 24, 64, 24, 64, 24, 64, 17, 64, 64, 64, 64, 64, 61,
11, 42, 64, 64, 64, 49, 36, 3, 64, 57, 64, 52, 12, 22, 11, 3, 33,
14, 5, 3, 16, 64, 16, 49, 5, 3, 49, 3, 3]),
80)hourly_Mbytes = ds_hp.salt.nbytes / 2 / 1024 / 1024
total_Mbytes = hourly_Mbytes * 24 * 356 * 20
print("chunk size of 3D value will be ", total_Mbytes / counts.size / (20 * 356))chunk size of 3D value will be 0.302398681640625
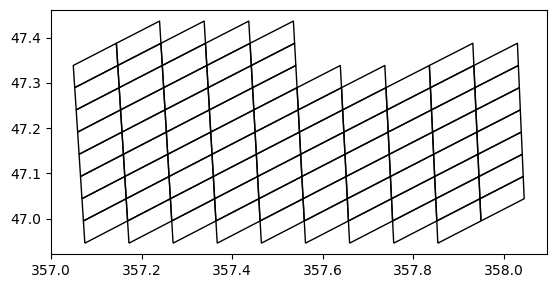
Step 3 — Build the parent-cell footprint polygon
Compute parent-cell vertices with healpix_geo.nested.vertices(...), convert to polygons, then merge them into a single footprint using a union operation.
import geopandas as gpd
import healpix_geo
import numpy as np
from shapely.geometry import Polygon

parents = uniq_parents.astype(np.uint64)

# vertices from healpix-geo
# Depending on your version, this returns either:
#   (lonv, latv)  OR  an array shaped (..., 2)
verts = healpix_geo.nested.vertices(parents, depth=parent_depth, ellipsoid="WGS84")

# --- normalize output to lonv, latv with shape (N, Nv) ---
if isinstance(verts, tuple) and len(verts) == 2:
    lonv, latv = verts
    print(latv)
else:
    verts = np.asarray(verts)
    # assume (..., 2) with last dim (lon,lat)
    lonv, latv = verts[..., 0], verts[..., 1]
    print(b)

lonv = np.asarray(lonv, dtype=np.float64)
latv = np.asarray(latv, dtype=np.float64)

# ensure 2D: (N, Nv)
if lonv.ndim == 1:
    lonv = lonv[None, :]
    latv = latv[None, :]


def _unwrap_dateline(lons):
    """Unwrap longitudes so polygons don't zigzag across the dateline."""
    lons = lons.copy()
    if (lons.max() - lons.min()) > 180:
        lons[lons < 0] += 360
    return lons


polys = []
for i in range(lonv.shape[0]):
    xs = _unwrap_dateline(lonv[i])
    ys = latv[i]
    # close polygon
    coords = list(zip(xs, ys))
    if coords[0] != coords[-1]:
        coords.append(coords[0])
    polys.append(Polygon(coords))

gdf = gpd.GeoDataFrame(
    {"parent_id": parents.astype(np.int64)},
    geometry=polys,
    crs="EPSG:4326",
)

ax = gdf.plot(edgecolor="k", facecolor="none")
ax.set_aspect("equal")
[[46.9456341 46.9947481 47.04385339 46.9947481 ]
[46.9456341 46.9947481 47.04385339 46.9947481 ]
[46.9947481 47.04385339 47.09295001 47.04385339]
[46.9456341 46.9947481 47.04385339 46.9947481 ]
[46.9947481 47.04385339 47.09295001 47.04385339]
[46.9456341 46.9947481 47.04385339 46.9947481 ]
[46.9456341 46.9947481 47.04385339 46.9947481 ]
[46.9947481 47.04385339 47.09295001 47.04385339]
[46.9947481 47.04385339 47.09295001 47.04385339]
[47.04385339 47.09295001 47.14203795 47.09295001]
[47.04385339 47.09295001 47.14203795 47.09295001]
[47.09295001 47.14203795 47.19111724 47.14203795]
[46.9947481 47.04385339 47.09295001 47.04385339]
[47.04385339 47.09295001 47.14203795 47.09295001]
[47.04385339 47.09295001 47.14203795 47.09295001]
[47.09295001 47.14203795 47.19111724 47.14203795]
[47.09295001 47.14203795 47.19111724 47.14203795]
[47.14203795 47.19111724 47.24018788 47.19111724]
[47.14203795 47.19111724 47.24018788 47.19111724]
[47.19111724 47.24018788 47.28924989 47.24018788]
[46.9456341 46.9947481 47.04385339 46.9947481 ]
[46.9456341 46.9947481 47.04385339 46.9947481 ]
[46.9947481 47.04385339 47.09295001 47.04385339]
[46.9456341 46.9947481 47.04385339 46.9947481 ]
[46.9456341 46.9947481 47.04385339 46.9947481 ]
[46.9947481 47.04385339 47.09295001 47.04385339]
[46.9947481 47.04385339 47.09295001 47.04385339]
[47.04385339 47.09295001 47.14203795 47.09295001]
[47.04385339 47.09295001 47.14203795 47.09295001]
[47.09295001 47.14203795 47.19111724 47.14203795]
[46.9947481 47.04385339 47.09295001 47.04385339]
[47.04385339 47.09295001 47.14203795 47.09295001]
[47.04385339 47.09295001 47.14203795 47.09295001]
[47.09295001 47.14203795 47.19111724 47.14203795]
[47.09295001 47.14203795 47.19111724 47.14203795]
[47.14203795 47.19111724 47.24018788 47.19111724]
[47.14203795 47.19111724 47.24018788 47.19111724]
[47.19111724 47.24018788 47.28924989 47.24018788]
[47.09295001 47.14203795 47.19111724 47.14203795]
[47.14203795 47.19111724 47.24018788 47.19111724]
[47.14203795 47.19111724 47.24018788 47.19111724]
[47.19111724 47.24018788 47.28924989 47.24018788]
[47.19111724 47.24018788 47.28924989 47.24018788]
[47.24018788 47.28924989 47.33830329 47.28924989]
[47.24018788 47.28924989 47.33830329 47.28924989]
[47.19111724 47.24018788 47.28924989 47.24018788]
[47.24018788 47.28924989 47.33830329 47.28924989]
[47.24018788 47.28924989 47.33830329 47.28924989]
[47.28924989 47.33830329 47.38734808 47.33830329]
[47.28924989 47.33830329 47.38734808 47.33830329]
[47.33830329 47.38734808 47.43638428 47.38734808]
[47.09295001 47.14203795 47.19111724 47.14203795]
[47.14203795 47.19111724 47.24018788 47.19111724]
[47.14203795 47.19111724 47.24018788 47.19111724]
[47.19111724 47.24018788 47.28924989 47.24018788]
[47.19111724 47.24018788 47.28924989 47.24018788]
[47.24018788 47.28924989 47.33830329 47.28924989]
[47.24018788 47.28924989 47.33830329 47.28924989]
[47.28924989 47.33830329 47.38734808 47.33830329]
[47.19111724 47.24018788 47.28924989 47.24018788]
[47.24018788 47.28924989 47.33830329 47.28924989]
[47.24018788 47.28924989 47.33830329 47.28924989]
[47.28924989 47.33830329 47.38734808 47.33830329]
[47.19111724 47.24018788 47.28924989 47.24018788]
[47.24018788 47.28924989 47.33830329 47.28924989]
[47.24018788 47.28924989 47.33830329 47.28924989]
[47.28924989 47.33830329 47.38734808 47.33830329]
[47.28924989 47.33830329 47.38734808 47.33830329]
[47.33830329 47.38734808 47.43638428 47.38734808]
[47.28924989 47.33830329 47.38734808 47.33830329]
[47.33830329 47.38734808 47.43638428 47.38734808]
[47.33830329 47.38734808 47.43638428 47.38734808]]
from shapely.ops import unary_union

footprint = unary_union(gdf.geometry)  # MultiPolygon or Polygon
footprintimport geopandas as gpd
gdf_fp = gpd.GeoDataFrame(geometry=[footprint], crs="EPSG:4326")
ax = gdf_fp.plot(edgecolor="k", facecolor="none")
ax.set_aspect("equal")
from shapely.ops import transform


def wrap_lon_180(x, y, z=None):
    x = ((x + 180) % 360) - 180
    return (x, y) if z is None else (x, y, z)


footprint_180 = transform(wrap_lon_180, footprint)

gdf_fp180 = gpd.GeoDataFrame(geometry=[footprint_180], crs="EPSG:4326")
ax = gdf_fp180.plot(edgecolor="k", facecolor="none")
ax.set_aspect("equal")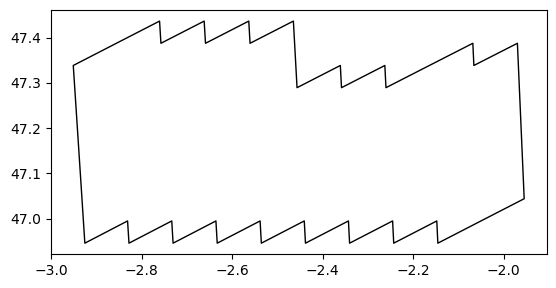
Step 4 — Overlay footprint on ROMS field
Plot a ROMS variable (e.g., salinity) using its curvilinear lon/lat coordinates (nav_lon_rho, nav_lat_rho), and overlay the footprint boundary for visual validation.
salt2d = xr.open_zarr("/Users/todaka/data/RIOMAR/small_withtime.zarr")["salt"].isel(
    time_counter=0, s_rho=0
)
lon2d = xr.open_zarr("/Users/todaka/data/RIOMAR/small_withtime.zarr")["nav_lon_rho"]
lat2d = xr.open_zarr("/Users/todaka/data/RIOMAR/small_withtime.zarr")["nav_lat_rho"]
import matplotlib.pyplot as plt
fig, ax = plt.subplots(figsize=(8, 6))
# salinity background (works for curvilinear grids)
m = ax.pcolormesh(lon2d, lat2d, salt2d, shading="auto")
plt.colorbar(m, ax=ax, label="Salinity")
# overlay footprint (Polygon or MultiPolygon)
def plot_geom_outline(ax, geom, **kw):
if geom.geom_type == "Polygon":
x, y = geom.exterior.xy
ax.plot(x, y, **kw)
elif geom.geom_type == "MultiPolygon":
for g in geom.geoms:
x, y = g.exterior.xy
ax.plot(x, y, **kw)
else:
# fallback for GeometryCollection etc.
try:
for g in geom.geoms:
plot_geom_outline(ax, g, **kw)
except Exception:
pass
plot_geom_outline(ax, footprint_180, color="k", linewidth=2)
ax.set_xlabel("Longitude (deg)")
ax.set_ylabel("Latitude (deg)")
ax.set_aspect("equal", adjustable="box")
ax.set_title("Salinity with HEALPix-parent footprint overlay")
plt.show()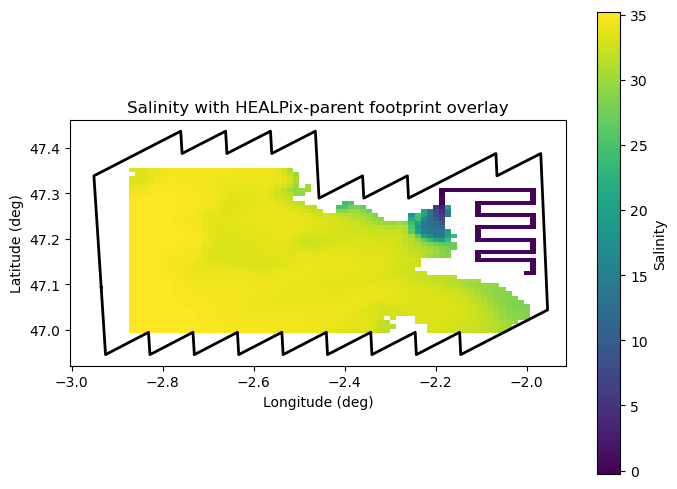
healpix_geo.nested.zoom_to(parents, depth=parent_depth, new_depth=depth)array([[224374592, 224374593, 224374594, ..., 224374653, 224374654,
224374655],
[224374656, 224374657, 224374658, ..., 224374717, 224374718,
224374719],
[224374720, 224374721, 224374722, ..., 224374781, 224374782,
224374783],
...,
[225780736, 225780737, 225780738, ..., 225780797, 225780798,
225780799],
[225780800, 225780801, 225780802, ..., 225780861, 225780862,
225780863],
[225780864, 225780865, 225780866, ..., 225780925, 225780926,
225780927]], shape=(80, 64), dtype=uint64)