This notebook converts a lon/lat bounding box into a HEALPix (nested) ROI, using healpix-geo.
What you’ll get
child-level HEALPix cell IDs that cover the bbox
parent-level cell IDs (optional coarser ROI)
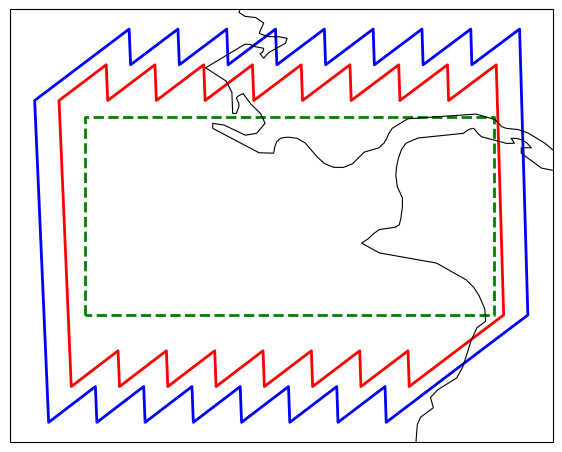
a boundary footprint polygon for plotting / masking workflows
Steps
Imports & helper(s)
Load dependencies and define helper function(s) used for boundary construction/plotting.Define bbox and compute child-level coverage
Set(lon_min, lat_min, lon_max, lat_max)andchild_level, then computechild_idscovering the bbox.Convert to parent level and save IDs
Setparent_level, convertchild_ids → parent_ids, deduplicate, and save toparent_ids.npz.Build outer boundary ring and export footprint
Chooseedge_level, compute an outer ring around the ROI, build a boundary polygon, and export toouter_boundary.geojson.5. Build/plot a boundary footprint, save them to geojson
Tuning
If the ROI boundary looks “cut” or missing along edges, increase the boundary refinement. Here we use :
edge_level = child_level - 2
Output
Save exported ROI Parent cell IDs / Parent level(parent_ids.npz) and footprint GeoJSON (outer_boundary.geojson) so Prep_regrid.ipynb can reuse them for masking/subsetting.
Step 1 — Imports and helper functions
import geopandas as gpd
import healpix_geo
import numpy as np
from shapely.geometry import Polygon, box
from shapely.ops import transform, unary_union
def get_boundary(cell_ids, level, plot=False):
lonv, latv = healpix_geo.nested.vertices(cell_ids, depth=level, ellipsoid="WGS84")
def _unwrap_dateline(lons):
lons = np.asarray(lons, dtype=float).copy()
if (np.nanmax(lons) - np.nanmin(lons)) > 180:
lons[lons < 0] += 360
return lons
polys = []
for i in range(lonv.shape[0]):
xs = _unwrap_dateline(lonv[i])
ys = latv[i]
# print(lonv[i],xs)
coords = list(zip(xs, ys))
if coords[0] != coords[-1]:
coords.append(coords[0])
polys.append(Polygon(coords))
footprint = unary_union(polys) # Polygon or MultiPolygon
# Wrap final footprint to [-180, 180] for plotting/overlay with lon=-180..180 data
footprint_180 = transform(wrap_lon_180, footprint)
if plot:
gdf_fp = gpd.GeoDataFrame(
{"name": ["footprint"]},
geometry=[footprint_180],
crs="EPSG:4326",
)
ax = gdf_fp.plot(edgecolor="k", facecolor="none", linewidth=2)
ax.set_aspect("equal")
return footprint_180
def wrap_lon_180(x, y, z=None):
x = ((np.asarray(x) + 180) % 360) - 180
return (x, y) if z is None else (x, y, z)Step 2 — Define the ROI bounding box
# Define The ROI bbox in  (lon/lat)
lon_min, lon_max = -2.8, -1.97333
lat_min, lat_max = 47.04367, 47.31558


bbox = (lon_min, lat_min, lon_max, lat_max)

child_level = 13

# Find out child (data projected ) cell_ids

child_ids, _, _ = healpix_geo.nested.zone_coverage(
    bbox=bbox,
    depth=child_level,
    ellipsoid="WGS84",
    flat=True,  # returns a 1D array of cell ids
)
print(f"N level {child_level} cells covering bbox: {child_ids.size}")
N level 13 cells covering bbox: 3218
Step 3 — Compute HEALPix coverage (child → parent) and save IDs
# Find out full parent cell id corresponding to the child (data projected ) cell_ids

parent_level = 10

# 2) Map child ids to parent ids
parent_ids = healpix_geo.nested.zoom_to(
    child_ids,
    depth=child_level,
    new_depth=parent_level,
)
parent_ids, counts = np.unique(parent_ids, return_counts=True)

print(f"N parent level {parent_level} cells: {parent_ids.size}")
# save parent_ids
np.savez(
    "parent_ids.npz",
    parent_ids=parent_ids,
    parent_level=parent_level,
)
# plot the parent cell ids
get_boundary(parent_ids, parent_level)
N parent level 10 cells: 71
Step 4 — Build boundary footprint (parent + outer ring) and export GeoJSON
# translate these parent_cell ids in edge_level.
edge_level = child_level - 2
print("boundary region is in level", edge_level)
##keep only the outer boundary cells from edges_ids
# edges_ids = healpix_geo.nested.internal_boundary(edge_level, edges_ids)
edges_ids = healpix_geo.nested.zoom_to(
    #    boundary_parents_ids,
    parent_ids,
    depth=parent_level,
    new_depth=edge_level,
)
edges_ids = np.unique(edges_ids, return_counts=False)
print(f"N edges level {edge_level} cells: {edges_ids.size}")

# get_boundary(edges_ids,edge_level)
boundary region is in level 11
N edges level 11 cells: 284
# find N+1 neighbour in edge_level
outer_edges_ids = np.unique(
    healpix_geo.nested.kth_neighbourhood(
        edges_ids, edge_level, ring=1, num_threads=0
    ),  # return_counts=True
)
print(f"N edges level {edge_level} outer edges cells: {outer_edges_ids.size}")
outer_boundary = get_boundary(outer_edges_ids, edge_level)
outer_boundary
N edges level 11 outer edges cells: 384
gdf = gpd.GeoDataFrame(
    {"name": ["outer_boundary"]},
    geometry=[outer_boundary],
    crs="EPSG:4326",
)

gdf.to_file("outer_boundary.geojson", driver="GeoJSON")
import cartopy.crs as ccrs
import matplotlib.pyplot as plt
fig, ax = plt.subplots(subplot_kw={"projection": ccrs.PlateCarree()}, figsize=(7, 7))
gdf_fp = gpd.GeoDataFrame(
{"name": ["parent_ids"]},
geometry=[get_boundary(parent_ids, parent_level, plot=False)],
crs="EPSG:4326",
)
gdf_fp.plot(ax=ax, edgecolor="red", facecolor="none", linewidth=2)
ax.set_aspect("equal")
gdf.plot(ax=ax, edgecolor="blue", facecolor="none", linewidth=2)
ax.coastlines(resolution="10m", linewidth=0.8)
gdf_bbox = gpd.GeoDataFrame(
{"name": ["bbox"]},
geometry=[box(*bbox)],
crs="EPSG:4326",
)
gdf_bbox.plot(ax=ax, edgecolor="green", facecolor="none", linewidth=2, linestyle="--")<GeoAxes: >