
Transform ARGO-KE products into DGGS (Healpix)#
Context#
Purpose#
The goal is to have the ARGO-KE into DGGS (healpix grid).
Description#
In this notebook, we will:
Open the timemean-velocity-product (Gray, Wortham, Kihle, TBD)
Transform the product into mean kinetic energy, MKE
Perform the regridding operation and visualize the regridded data with xdggs.
Contributions#
Notebook#
Ola Formo Kihle (author), Independent Consultant / UW Contractor, (Norway), @ofk123
Even Moa Myklebust (reviewer), Simula Research Laboratory (Norway), @evenmm
Anne Fouilloux (reviewer), Simula Research Laboratory (Norway), @annefou
Bibliography and other interesting resources#
Velocity-product (Gray et al., TBD)
Install packages#
If
xdggsand/orxarray-healpyare not available in your Python environment, uncomment the cells below to install these packages.
#!pip install git+https://github.com/xarray-contrib/xdggs.git
#!pip install git+https://github.com/IAOCEA/xarray-healpy.git
Install Libraries#
import xarray as xr, numpy as np
import s3fs
import xdggs
#_ = xr.set_options(display_expand_data=False)
_ = xr.set_options(display_expand_data=False, display_expand_attrs=False, keep_attrs=True)
Open ARGO-KE data product#
The data sample is stored in a bucket on PANGEO-EOSC and is readable by anyone.
s3 = s3fs.S3FileSystem(
    anon=True,
    endpoint_url='https://pangeo-eosc-minioapi.vm.fedcloud.eu/'
)
s3_bucket= 'okihle-workathon/'
store_s3 = s3fs.S3Map(
    root=s3_bucket + 'argo-vel-data',
    s3=s3,
    check=False
)
ds = xr.open_zarr(store_s3, consolidated=True)
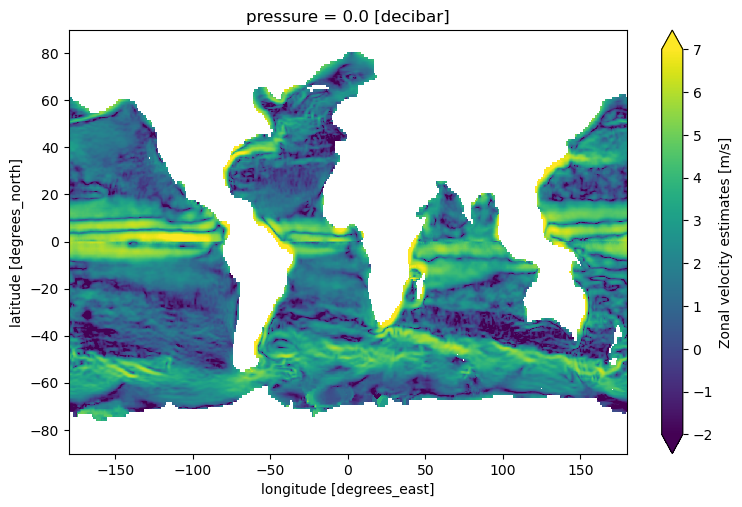
Visualise Mean KE#
np.log(1e4 * 0.5 * (ds.u**2 + ds.v**2)).compute().plot(
    figsize=(9, 5.5), cmap="viridis", vmin=-2, vmax=7
)
<matplotlib.collections.QuadMesh at 0x70922b2f2c00>
Prepare Healpix grid for regridding#
nside = 64
def center_longitude(ds, center):
    if center == 0:
        centered = (ds.longitude + 180) % 360 - 180
    else:
        centered = (ds.longitude - 180) % 360 + 180
    return ds.assign_coords(longitude=centered)
from xarray_healpy import HealpyGridInfo, HealpyRegridder
# Define the target Healpix grid information
grid = HealpyGridInfo(level=int(np.log2(nside)))
target_grid = grid.target_grid(ds).pipe(center_longitude, 0).drop_attrs(deep=False).dggs.decode({"grid_name": "healpix", "nside": nside, "indexing_scheme": "nested"})
Compute the interpolation weights for regridding the diff data#
%%time
regridder = HealpyRegridder(
    ds[["longitude", "latitude"]].compute(),
    target_grid,
    method="bilinear",
    interpolation_kwargs={},
)
regridder
CPU times: user 4.24 s, sys: 185 ms, total: 4.42 s
Wall time: 4.43 s
HealpyRegridder(method='bilinear', interpolation_kwargs={})
Perform the regridding operation using the computed interpolation weights.#
%%time
regridded = regridder.regrid_ds(ds).pipe(xdggs.decode)
CPU times: user 1.34 s, sys: 568 ms, total: 1.9 s
Wall time: 1.92 s
Visualise regridded data with xdggs#
da = np.log(1e4 * 0.5 * (regridded.u**2 + regridded.v**2)).compute().squeeze()
da.dggs.explore()